

Air Quality Projects
We have been working with Stanford University, UC Berkeley, and UC Davis to help South City residents get the tools and technology they need to ensure their physical well-being.
South San Francisco Air Quality Dashboard
Leah Redd, a Stanford University student studying Data Science and Social Systems, developed a real-time air quality dashboard for South San Francisco, integrating data from PurpleAir and Clarity air monitors, providing residents with accessible information through a bilingual platform that is also mobile-friendly.

A threshold is the pollution limit set by the World Health Organization — when air pollution exceeds this limit, it’s marked as ‘above the threshold.’ The interactive map shows how many days a certain monitor go over this threshold.
Community Air Monitors
Below are descriptions and project histories for the air quality monitors deployed by student researchers and collaborators. Two types of monitors — Clarity and PurpleAir — directly feed data into the Air Quality Dashboard above. Other monitors, such as TARTA, contribute to broader environmental research efforts.
Clarity Monitors
Clarity’s Node-S air quality sensors provide real-time, reliable air pollution data for South San Francisco, measuring key pollutants like PM₂.₅ and nitrogen dioxide (NO₂). Co-deployed through the Air Quality Collaborative with Rise South City, Brightline Defense, and the Sequoia Foundation, these solar-powered monitors support community-driven air monitoring efforts.

Clarity’s OpenMap is an interactive, real-time air quality map displaying thousands of air pollution sensors across the United States and beyond. The map shows live data from Clarity’s Node-S monitors and official government reference stations, using color-coded Air Quality Index (AQI) readings based on U.S. EPA standards. Viewers can track key pollutants like PM₂.₅ and nitrogen dioxide (NO₂), explore air quality trends over time, and access health-based recommendations.
Clarity Interactive Map
Clarity sensors are low-maintenance, calibrated for accuracy, and designed to make local air quality data accessible to the public. Data from Clarity monitors feeds directly into the Rise South City Air Dashboard above.
Clarity Monitors in the Cal Fire and Smoke Map 4.2

Our Clarity sensors in South San Francisco are now part of the EPA’s AirNow Fire and Smoke Map (Version 4.2). This updated map integrates data from Clarity Movement Co. sensors—including ours we've deployed locally—to provide more detailed, hyperlocal information on fine particle pollution (PM2.5). These additional sensors help the public better understand smoke conditions in their area and take steps to reduce exposure.
In addition to displaying real-time Air Quality Index (AQI) data, the interactive map also shows active wildfire locations across the continent, along with forecasts of smoke movement and plume direction.

PurpleAir Monitors

Dr. Cesunica Ivey is an assistant professor in the Civil and Environmental Engineering Department at the University of California, Berkeley, and generously provided over 25 air quality sensors to Rise.
Xavier Gomez was born and raised in South SF and is a co-terminal student pursuing his Master's degree in Earth Systems at Stanford University. He took the lead on installing the first PurpleAir sensors of the initiative. His work was part of his capstone project for the Earth Systems undergrad program.


In addition to installing sensors, Xavier considered the largely Spanish-only-speaking population of the city, many of whom didn't go to school beyond elementary. He made it a point to create easy-to-understand maps in both English and Spanish.
TARTA Monitors

Dr. Clare E.B. Cannon is an Associate Professor of Social and Environmental Justice in the College of Agricultural and Environmental Sciences at the University of California, Davis. As a key contributor to the Air Quality Research Center, Dr. Cannon is leading efforts to deploy Toxic-Metal Aerosol Real-Time Analysis (TARTA) instruments across California. These innovative devices are designed to detect and quantify 16 different airborne metallic compounds, offering a low-cost, energy-efficient alternative to traditional ambient toxic metal analyzers. Her work is advancing environmental monitoring and promoting equitable access to clean air data across communities.
Dr. Clare Cannon, PhD, Alex Sanchez, MS, and Michaela Anang, JD are partnering with Rise South City through the UC Community Air Project (CAP)—an initiative dedicated to empowering communities disproportionately impacted by poor air quality. Together, they are advancing community-led research and deploying cutting-edge air monitoring tools like the Toxic-Metal Aerosol Real-Time Analysis (TARTA) instrument.
TARTA enables real-time detection and quantification of 16 hazardous atmospheric metallic compounds—an area of air quality that has historically been difficult to measure due to high costs and limited mobility of traditional equipment. By integrating this novel technology into community spaces, the team is helping residents gain access to critical air quality data, fostering environmental awareness, and supporting informed advocacy for healthier, more equitable neighborhoods.

.Photo taken at a monitoring site in San Bruno (photo credit Michaela Anang).
Click the PDF icon to explore the full San Bruno: Community Air Quality Report.
This comprehensive report presents an in-depth overview of current air quality conditions in San Bruno, outlines key regulatory frameworks, and shares preliminary findings and insights from the 2025 Community Air Project (CAP). Discover how local data is shaping our understanding of air quality in San Bruno.
Facility Site Emissions & Monitoring Map
This map shows permitted industrial facilities in South San Francisco and San Bruno that emit harmful air pollutants, including copper, nickel, manganese, and diesel exhaust particles. These pollutants are known to contribute to serious health risks. The blue areas represent locations where TARTA monitors are deployed to track airborne heavy metals, providing real-time, community-level air quality data.

Stanford Data Science & Social Systems Projects
Rise South City Community Dashboard
Developed by Stanford University students (Mack Smith, Enkhjin Munkhbayar, and Isaac Krementsov) the Rise South City Community Dashboard is an interactive, bilingual web tool designed to help residents of South San Francisco and San Bruno better understand local air pollution and health risks.
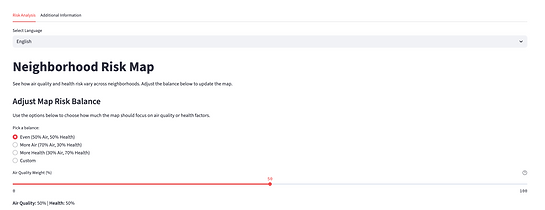


The dashboard combines real-time air quality data from Clarity and PurpleAir monitors with health and demographic indicators to generate neighborhood-level risk maps.
Users can:
-
Explore composite risk scores for each census tract.
-
Search by address to view localized pollution and health vulnerability information.
-
Adjust the weighting between air quality and health risk factors.
-
View air monitor locations alongside predictability scores, reflecting data reliability.
If you see a "This app has gone to sleep" message, just click "Yes, get this app back up!" to reload the tool.
South City & San Bruno Air Quality & Health Dashboard
Stanford University students (Lauren He, Serena Lee, Olivia Sun) partnered with Rise South City to create an interactive dashboard that visualizes air pollution levels and respiratory health risks in South San Francisco and San Bruno. The tool empowers community members, advocates, and policymakers to better understand the links between air quality and public health in their own neighborhoods.
If you see a "This app has gone to sleep" message, just click "Yes, get this app back up!" to reload the tool.
.Key Features:
-
Air Quality & Asthma Map: View pollution levels and asthma rates by neighborhood.
-
Air Quality Trends: See how air quality changes over time.
-
Graph Library: Explore how pollution relates to health and income.
-
Multi-Language: Available in English, Spanish, and Mandarin.
-
Search by Address: Look up air quality and health risks near your home.


Clarity Air Quality Data Report: October, 2024 - March, 2025
This report was collaboratively developed by the Air Quality Coordinator and the 2025 Stanford University Data Science Capstone team to analyze spatial and temporal trends in fine particulate matter (PM2.5) measured by Clarity Air Monitors in South San Francisco and San Bruno. The analysis covers the period from October 2024, when the monitoring network was first deployed, through March 2025.
The report provides an overview of the establishment of the regional air quality monitoring network and the motivations for collecting and publicly sharing localized air quality data. It examines seasonal and temporal trends in PM2.5 concentrations, evaluates patterns observed at monitors deployed at school sites, and introduces predictability indices to better understand short-term air quality variability. Additionally, the report explores the spatial distribution of PM2.5 across census tracts, offering insight into neighborhood-level differences in air quality and potential equity implications.
Click the PDF icon to explore the full Clarity Air Quality Data Report
South San Francisco Air Quality Perception Survey
From January to May 2025, through the Haas Center’s Graduate Public Service Program, four Stanford graduate students partnered with Rise South City to co‑design a community Air Quality Survey. The team developed both written and verbal survey formats, prioritizing inclusive language, clarity, and privacy to ensure residents could participate comfortably and meaningfully. This collaborative effort laid an important foundation for future outreach and community‑driven environmental work.
The survey gathers input from South San Francisco residents, particularly those living in Paradise Valley, Lindenville, Downtown South San Francisco, and East of 101, about their experiences with local air quality. It explores perceptions of pollution, traffic impacts, transportation accessibility, health concerns, and residents’ willingness to engage in air‑quality interventions such as wearing masks and hosting air monitors. Insights from the survey will help identify community needs, deepen understanding of local health and environmental impacts, and guide future air‑quality improvements in South San Francisco. Click HERE to read the survey distributed in July 2025.